440
Views & Citations10
Likes & Shares
RESEARCH HYPOTHESES
The following hypothesis is set out to guide the focus of the study;
Hypothesis I: (H0): There is no significant difference in precipitation variability in Upper Benue River Basin for the period 1981-2021.
Hypothesis II: (H0): There is no significant difference in temperature variability in Upper Benue River Basin for the period 1981-2021.
METHODOLOGY
This study made use of both primary and secondary data. The climatological data of the basin comprising, precipitation and temperature for 41 years was acquired from the gridded climatological data (precipitation and temperature) of the Intergovernmental Panel on Climate Change (IPCC) repository (https://www.ipcc/data.org). It was downloaded from the IPCC website and downscaled to match the extent of the study area using the map of the study area. The essence is to make up for the inadequate weather stations, data unavailability and data incompleteness for the study area within the period under study. This enhanced the quality of outcome and visualization of spatial variation. To ensure data quality control and assurance, the data derived from IPCC website was aligned with (Nigerian Meteorological Agency) NiMet station data found in the study area. For seasonal analysis, each year was divided into two climatic seasons, namely wet (April - October), and dry seasons (November-March) in line with NiMet stipulation. Analysis of the data was carried out for month, season and year for temperature and Precipitation for the period 1981-2021.For testing hypothesis, (Ho 1), the magnitude of a trend in a time series was determined using a non-parametric method known as Sen’s estimator. The statistical significance of the trend in the time series was analyzed using Mann-Kendall (MK) test [9,10]. The Sen’s method uses a linear model to estimate the slope of the trend, and the variance of the residuals should be constant in time calculated as:
Qi=Xj-Xkj-K for i=1,2,3…n
In this equation, Xj and Xk denote values of data at time j and k, respectively, and time j is after time k (k ≤ j). The median of “n” values of Qi is the Sen's slope estimator test. A negative Qi value represents a decreasing trend; a positive Qi value represents an increasing trend over time.
The Mann-Kendall statistical test has been frequently used to quantify the significance of trends in hydro-meteorological temporal datasets [9,11-17].
The Mann-Kendall is calculated as: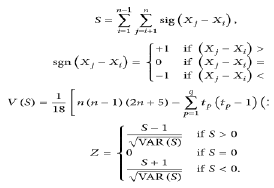
Where n signifies the length of the dataset,
Xj and Xi are the successive information esteems on occasion
j and i, sgn means the sign capacity that takes on the values 1, 0, or−1; if Xj> Xi, Xj=Xi or Xj<Xk, individually.
S values if Positive demonstrate an expanding (upward) trend, and value of S if negative uncover the decreasing (descending) trend in the data time series.
For tests, n >10, the test is directed utilizing distributional is normal (σ2= 1) and mean (μ= 0) (Helsel and Hirsch, 1992), variance (Var) and with expectation (E).
The determined standardized Zmk values follow distribution normal with variance normal "0"and "1”, it is utilized a measure of trend significance. In fact, this test measurement is utilized to null hypothesis test, H0 if Zmk is more than Zα/2. This value of Zmk is contrasted and standard distribution normal table of two followed test at certainty levels of α=1 %, α=5 % and α=10 %. In a two-followed test, null hypothesis (H0) is accepted for no trend if the determined value of Zmk between – Z1-α/2 and Z 1-α/2, and in this way, H1 is rejected.Climatic parameter measurement (precipitation and temperature) come as gridded point observations and cannot be used as a representative value for the area under consideration. Therefore, it is necessary to obtain effective uniform depth of precipitation of the study area to get a more reliable and representative results. Areal depth of precipitation and temperature in the Upper Benue River Basin was estimated using simple arithmetic mean, isohyetal and Krigging interpolation methods in ArcGIS 10.3 using the downscaled point-based data derived from IPCC website. This study therefore includes interpolation of precipitation data in the form of point rain gauge readings from 25 rain gauge stations spread across the study area. The point rain gauge data are handled using MS EXCEL spreadsheets in order to calculate yearly precipitation and other statistical parameters. The analysis was carried out using Geographic Information System (GIS) Technology.
RESULT OF THE FINDINGS
Spatial and Temporal Variation of Precipitation
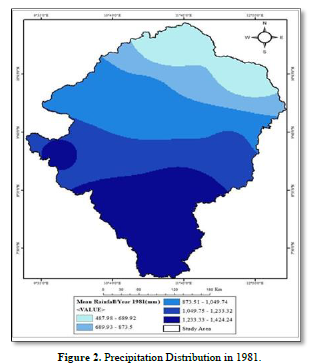
The spatio-temporal variation in precipitation for the study area is presented in Figure 1, and each of the 4 decades covered is presented spatially on a map (Figures 2-6) and summarized in Figure 7 which indicated the dynamics of annual precipitation over the study area from the periods of 1981-2021.
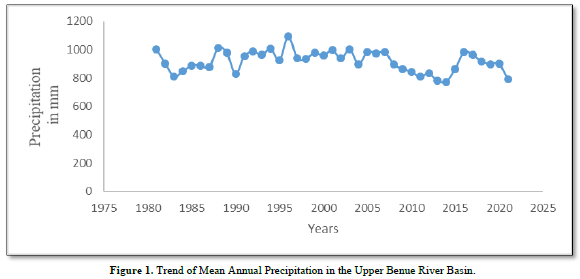

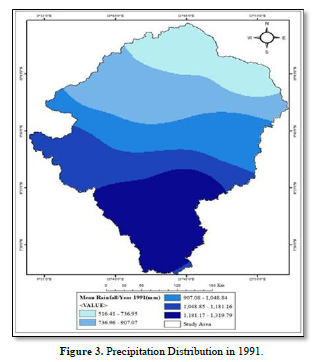

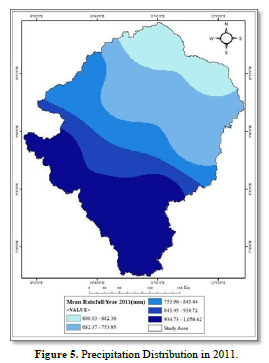

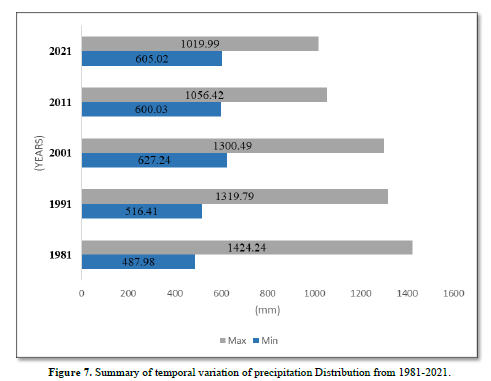
Figure 1 shows the variability in precipitation over the study area. There was a decrease of 193.7mm in the mean annual precipitation between 1981 to 1983, from 1002.8 mm to 809.1mm. However, there was an upward fluctuation from 1983 to 1987 where the precipitation reached 876.5mm in 1987. The area showed an abrupt rise in precipitation between 1987 and 1988 where it reached 1012.7mm before a decline in 1989 (976.9mm) and 1990 (827.6mm). The precipitation was observed to be on the increase though with several fluctuations reaching the highest peak amount of 1093mm in 1996 but this upward trend was not sustained as there was a gradual but steady fluctuation below the 1996 threshold with the lowest amount of precipitation (773.9mm) recorded over the basin in 2014. Another sharp rise in the annual rainfall was recorded in the basin up till 2016 where it recorded 982.3mm and a downward trend which ended the study period with 790.7mm in 2021. This result in the Upper Benue River Basin is congruent with the studies of Trenberth (2011) and National Oceanic and Atmospheric Administration [NOAA] (2021) which observed a direct influence of global warming on precipitation as increased heating leads to greater evaporation and thus surface drying, thereby increasing the intensity and duration of drought. This observed fluctuation in the precipitation regime of the study area can be attributed to the effect of climate change in the area. Precipitation intensity and frequency can be impacted by climate change. Oceans that are warmer cause more water to evaporate into the atmosphere. More moisture-laden air can produce more intense precipitation when it flows over land or merges with a storm system (NOAA, 2021). The map in figure2 to fig. 6 presents the yearly variabilities in precipitation over the Upper Benue River Basin.
As indicated in Figure 2, for the year 1981, the annual precipitation ranged from 487.98 mm to 1424.24mm. The spatial pattern observed indicates a northward decrease in the amount of precipitation over the study area. It is evident that precipitation in the basin decreases with increasing latitude. From latitude 7° 15 N to about latitude 8° 35N in 1981, the precipitation distribution was between 1,233.33mm to 1,424.24mm and also on the eastern flank of the basin close to 9°.00 N. However, the precipitation decreased between latitude 8° 35 N to long 9° 45 N (1,049.75mm- 12,233.32mm). Further North, the precipitation decreased between latitude 9° 39N to about latitude 10° 55N (689.93-873.5mm) and this trend continued till the uppermost north of the basin with precipitation distribution of between 487.98 to 689.92mm. This agrees with Huang, Sun, Xue & Zhang [18] in Mongolia, northern China. The result of the findings in Figure 3 reveals that the northward decline in the annual rainfall pattern for 1991 remains persistent with slight variation in comparison to 1981.The range of rainfall was between 516.41mm to 1319.79 mm. The result here shows that precipitation decreased with increasing latitude towards the north. In 1991, between Latitude 7° 15N and 8° 35N, the precipitation was between 1,181.17 to 1,319.79mm. However, this further decreased between 1,048.85mm to 1,181.16mm between latitude 8° 35N to latitude 9° 40N at the eastern flank of the basin. Further north between Latitude 9° 40N to 10° 15N, the precipitation was between 907.08mm to 1, 048.84mm. This trend is sustained decreasing further till the upper part of the basin to 516.4mm to 736.9mm. This agrees with Huang, Sun, Xue & Zhang [18] in Mongolia, northern China.
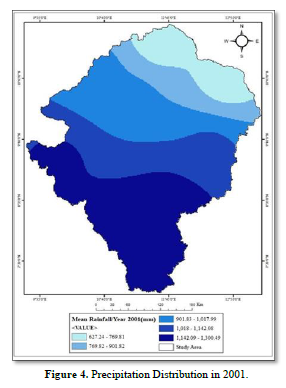
As presented in Figure 4, the minimum range stood at 627.24mm -769.81mm, a significant increase from the previous two epochs (1981 and 1991). The maximum range was between 1142.09mm - 1300.49mm, depicting declining values from previous years. The result here shows that precipitation decreased with increasing latitude towards the northern part of the study area. In 2001, between latitude 7° 15N and 8° 35N, the precipitation was between 1,142.09 to 1,300.49mm. However, this further decreased between 1,018.00mm to 1,142.08mm between latitude 8° 35N to latitude 9° 40N at the eastern flank of the basin. Further north between latitude 9° 40N to 10° 15N, the precipitation was between 901.83mm to 1, 017.99mm. This trend is sustained decreasing further till the upper part of the basin to 627.24mm to 769.81mm. This agrees with Huang, Sun, Xue & Zhang [18] in Mongolia, northern China. For the year 2011, as seen in Figure 5, the minimum range stood at 600.03 mm - 682.36 mm, while the maximum range values recorded 934.73mm - 1056.42mm. This indicates a further decline from the previous periods. The spatial pattern however remained consistent with slight variations. The result here shows that precipitation decreased with increasing latitude towards the north pole. In 2011, between Latitude 7° 15N and 8° 35N, the precipitation was between 935.73 to 1,056.42mm. However, this further decreased between 843.45mm to 934.72mm between latitude 8° 35N to latitude 9° 40N at the eastern flank of the basin. Further north between Latitude 9° 40N to 10° 15N, the precipitation was between 753.96mm to 843.44mm. This trend is sustained decreasing further till the upper part of the basin to 600.03mm to 682.36mm. This agrees with Huang, Sun, Xue & Zhang [18] in Mongolia, northern China.
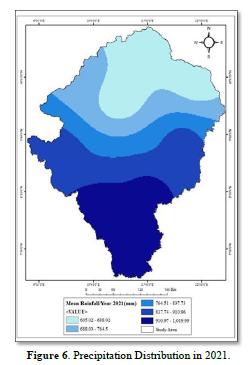
As reflected in Figure 6, annual minimum precipitation values were 605.02mm - 688.02mm, while the maximum values recorded a range of 910.97mm - 1019.99mm. The result here shows that precipitation decreased with increasing latitude towards the north pole. In 2021, between latitude 7° 15N and 8° 35N, the precipitation was between 910.97mm to 1,019.99mm. However, this further decreased between 837.74mm to 910.96mm between latitude 8° 35N to latitude 9° 40N at the eastern flank of the basin. Further north between Latitude 9° 40N to 10° 15N, the precipitation was between 764.51mm to 837.73mm. This trend is sustained decreasing further till the upper part of the basin to 605.02mm to 688.02mm. While there has been fluctuating minimum values, the maximum values remained steadily on the decline. This agrees with Huang, Sun, Xue & Zhang [18] in Mongolia, northern China.
As presented in Figures 2-7 is a summary of the variation in precipitation, and it shows that there is a consistent decrease in the maximum values of precipitation for the study period. From 1981, the precipitation amount dropped from 1424.24mm to 1019.99mm in 2021, marking a significant difference of 404.25mm. On the other hand, minimum precipitation values have been on the increase from 487.98mm in 1981 to 605.02mm in 2021, marking an increase of 117 mm. On the whole, the overall ranges for the years considered have been seen to be on the decline northwards and overtime. This is the footprint of rainfall uncertainty. This result is congruent with the studies of Odjugo [19] which observed rainfall decreases of 1350mm from 1941-1970 to 1276mm from 1970-2002. Similarly, a recent study by Abaje and Oladipo [20] in Kaduna, in the Northwest region of Nigeria also showed a similar decrease in the trend of rainfall from 1971 to the late 1990s, however, their result showed a little increase in rainfall over Kaduna between 1991 to 2016. Additionally, the study agrees with Dike [21] whose study on intensification of summer rainfall over Nigeria in the recent decades shows that the Sahel region is experiencing decreasing wet-day rainfall frequency but increasing intensity leading to flooding in the region.
Spatial and Temporal Variation of Temperature in Upper Benue River Basin
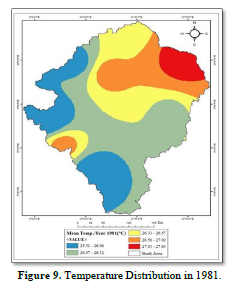
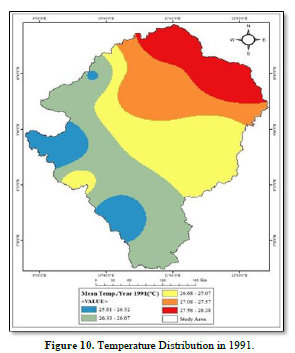
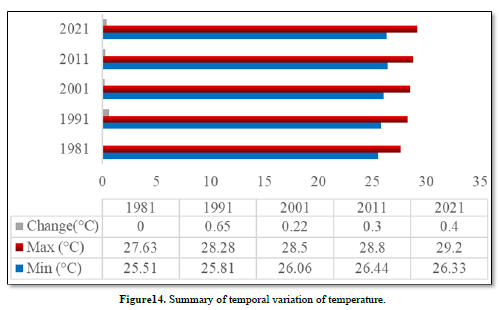
The spatio-temporal variation in temperature for the study area is presented in Figure 8 and each of the 4 decades covered is presented spatially on a map (Figures 9-13) and summarized in Figure 14 which indicated the dynamics of annual temperature over the study area for the periods of 1981-2021.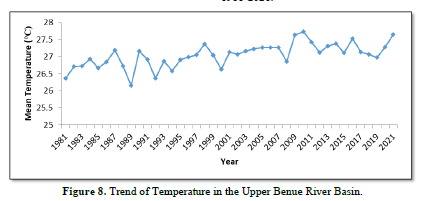


The Figure 8 shows that in 1981, the mean annual temperature in the Upper Benue River Basin was 26.4℃, which rise to 26.7℃ in 1982 and 1983 respectively. The temperature further increased to 26.9℃ in 1984 and decreased to 26.7℃ in 1985. From 1985 to 1987 an increasing trend was observed from 26.8℃ in 1986 to 27.2℃ in 1987. Howbeit, there was a sharp decrease from 26.7℃ in 1988 to 26.2℃ in 1989. A surge in temperature to 27.2℃ was recorded in 1990 but a decline in 1991 (26.9℃) and 1992 (26.4℃). From 1992 to 2021, the temperature has been on a steady but staggering increase reaching highest peak of 26.9℃ in 1993, 27.4℃ in 1998, 27.1℃ in 2001, 27.3℃ in 2007, 27.7℃ in 2010 and 27.6℃ in 2021 respectively. The visual display of the changes in temperature distribution over the basin is shown on maps in Figures 9-13.
Looking at the spatial pattern of the temperature in 1981, as seen in Figure 9, it can be deduced that the northern part of the study area is characterized by relatively higher temperatures and it decreases westwards and southwards.
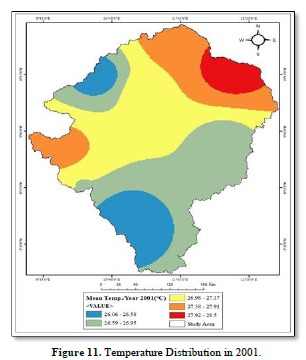
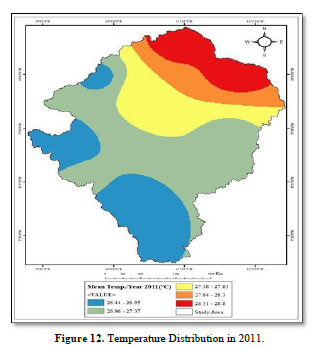
Finding of the study from Figure 11 show the temperature of the basin for the year 2001. In 2001 temperatures were relatively cooler between latitude 7°15N to about 8° 25N and the southwestern part of the basin. The result also indicates a marked difference in the spatial pattern, relative to the previous years. The result here shows that temperature does increase with increasing latitude towards the north pole although temperatures are relatively higher on lower latitude especially close to the equator. Because the angle of radiation varies depending on the latitude, surface temperatures on average are warmer in the northeast side of the Upper Benue River Basin. In 2011 temperatures were relatively cooler between latitude 7°15N to about 8° 25N and the southwestern part of the basin.
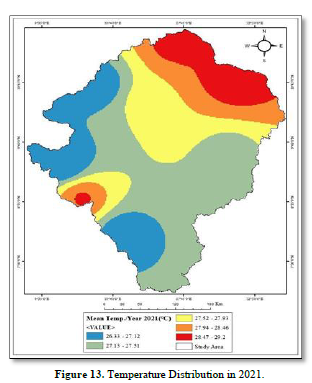
Figure 13 shows the change in spatial spread of temperature across the study area, the maximum value for the year 2021 remains the highest compared to the previous decades. The result shows that temperature increased also with increasing latitude in the basin.
As presented in Figure 14. It can be deduced that the maximum annual average temperatures recorded for the four decades considered Figures 9-13 has been on the increase from 27.63°C in 1981 to 29.2°C in 2021 with a difference of 1.57°C. The highest flux of 0.65°C was recorded between 1981 and 1991, followed by the period between 2011 and 2021 with 0.4°C. This result is corroborated by the findings of the study by Abaje and Oladipo [20] whose study in Kaduna showed an increasing trend over the last two decades. Similarly, this result agrees with Mbanyeude [22] which posited that the north experiences a dry season with high temperatures reaching 38℃ monthly. In March, 2022, the Nigerian Meteorological Agency, NiMet had predicted a rise in temperature particularly over the Northern part of the country [23].
Trend of Climatic Variability using Mann Kendall and Sen’s Slope Estimator
Having presented the outcome of the spatial and temporal variation of precipitation and temperature, this section tests the statistical significance of the trend of each variable using a fusion of the Mann Kendall and Sen’s slope estimation statistical analysis. The outcomes are presented in subsequent sessions (Tables 1 & 2).

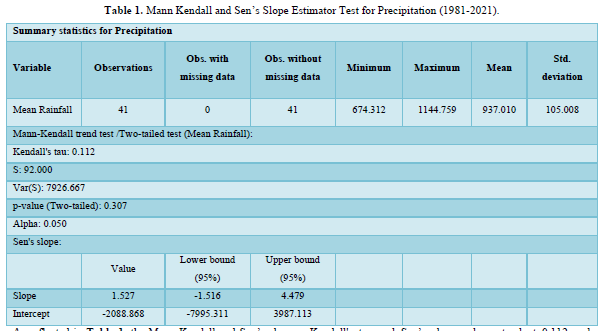
As reflected in Table 1, the Mann Kendall and Sen’s slope estimator analysis for precipitation shows that for the whole study period (1981-2021), the lowest recorded values for precipitation were 674.3 mm while the highest recorded annual average stood at 1144.8 mm, with an overall mean of 937mm and standard deviation 105mm. However, while Kendall's tau and Sen’s slope values stood at 0.112 and 1.527 respectively, the outcome of p-value (Two-tailed) test of significance is 0.307. As the computed p-value is greater than the significance level alpha=0.05, This implies that there is no significant trend in average annual precipitation over the time of study.
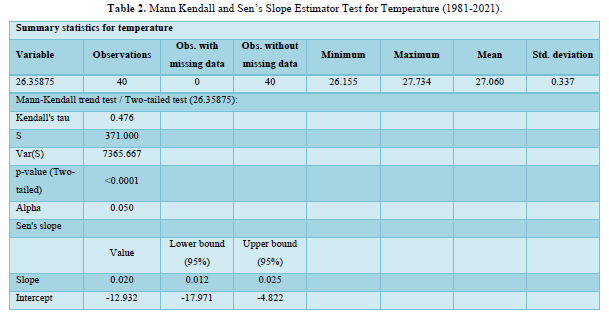
As shown in Table 2, the Mann Kendall and Sen’s slope estimator test for trend of temperature reveals that with a P value <0.05 and a slope value of 0.02, there was a significant trend in temperature for the period under study. This result agrees with Frimpong, Korantengand Molkenthin [24] as their study’s Mann Kendall and Sen’s slope revealed significant trends in the annual and seasonal (dry and wet seasons) in minimum temperature in the Accra and Kumasi Metropolis in Ghana. They further posited the observed increase in temperature might lead to an increased rate of heat-stressed diseases and an overall rise in urban warming in both cities. The findings emphasize the importance of assessing temperature trends and indices in light of worries about climate change and its impact in the northern part of Nigeria.
CONCLUSION
The study has examined climate change and variability in the Upper Benue River Basin Nigeria. The study used climatological data (precipitation and temperature) for 41 years acquired from the gridded climatological data of the website. This was downscaled to match the extent of the basin using map. The findings of the study reveal high variability in precipitation in the basin from 1093mm in 1996to 773.9mm in 2014. The findings of the study also reveal that mean annual temperature in the basin has been on rise from of 26.4℃ in 1981 to 29.2°C in 2021.
RECOMMENDATIONS
Based on the findings of the study, the following recommendations are made;
- There is the need for the integration of existing weather station data from in-situ observation with the gridded satellite data for a better and robust climate picture of the basin.
- There is need to increase the number of functional ground weather station with state-of-the-art equipment in the basin to increase the generation and dissemination of climate information to farmers and other users in the country.
- There is need to reduce deforestation and fuelwood exploitation in the basin as a way of protecting vegetation cover and adapting to climate change in the area.
- Akande A, Ana CC, Jorge M, Robert H (2017) Geospatial Analysis of Extreme Weather Events in Nigeria (1985-2015) Using Self-Organizing Maps. Adv Meteorol 2017(2): 1-11.
- Ebele NE, Emodi NV (2016) Climate change and its impact in Nigerian economy. J Sci Res Rep 10(6): 1-13.
- Amanchukwu RN, Amadi TG, Nwachukwu PO (2015) Climate change education in Nigeria: The role of curriculum review. Education 5(3): 71-79.
- Olapido E (2010) Towards enhancing the adaptive capacity of Nigeria: a review of the country’s state of preparedness for climate change adaptation. Heinrich Böll Foundation Nigeria. Available online at: https://ng.boell.org/sites/default/files/uploads/2013/10/nigeria_prof_oladipo_final_cga_study.pdf
- Enete IC (2014) Impacts of climate change on agricultural production in Enugu State, Nigeria. J Earth Sci Clim Chang 5(9): 234.
- National Climate Change Policy (NCCP) (2021) National Climate Change Policy for Nigeria 2021 - 2030. Federal Ministry of Environment (FMEnv) Abuja, Nigeria.
- Department for International Development (DFID) (2009) Impact of climate change on Nigeria’s economy: Final report.
- Odjugo PAO (2010) General Overview of Climate Change Impacts in Nigeria. J Hum Ecol 29(1): 47-55.
- Kendall MG (1975) Rank Correlation Methods, 4th Charles Griffin, London.
- Mondal A, Kundu S, Mukhopadhyay A (2012) Rainfall trend analysis by Mann-Kendall test: A case study of north-eastern part of Cuttack district, Orissa. Int J Geol Earth Environ Sci 2(1): 70-78.
- Subash N, Sikka AK (2014) Trend analysis of rainfall and temperature and its relationship over India. Theor Appl Climatol 117: 449-462.
- Yue S, Pilon P, Cavadias G (2002) Power of the Mann-Kendall and Spearman's rho tests for detecting monotonic trends in hydrological series. J Hydrol 259(1-4): 254-271.
- Tabari H, Nikbakht J, ShiftehSome’e B (2012) Investigation of groundwater level fluctuations in the north of Iran. Environ Earth Sci 66: 231-243.
- Duhan D, Pandey A (2013) Statistical analysis of long term spatial and temporal trends of precipitation during 1901-2002 at Madhya Pradesh, India. Atmos Res 122: 136-149.
- Da Silva RM, Santos CA, Moreira M, Corte RJ, Silva VC et al. (2015) Rainfall and river flow trends using Mann-Kendall and Sen’s slope estimator statistical tests in the Cobres River basin. Nat Hazards 77: 1205-1221.
- Ali RO, Abubaker SR (2019) Trend analysis using Mann-Kendall, Sen's slope estimator test and innovative trend analysis method in Yangtze River basin, China. Int J Eng Technol 8(2): 110-119.
- Mann HB (1945) Non-parametric tests against trend, Econometrica 13: 163-171.
- Huang J, Sun S, Xue Y, Li J, Zhang J (2014) Spatial and temporal variability of precipitation and dryness/wetness during 1961-2008 in Sichuan province, west China. Water Resour Manag 28: 1655-1670.
- Odjugo PA (2005) An analysis of rainfall patterns in Nigeria. Glob J Environ Sci 4(2): 139-145.
- Abaje IB, Oladipo EO (2019) Recent changes in the temperature and rainfall conditions over Kaduna State, Nigeria. Ghana J Geogr 11(2): 127-157.
- Dike VN, Lin Z, Fei K, Langendijk GS, Nath D (2022) Evaluation and multimodel projection of seasonal precipitation extremes over central Asia based on CMIP6 simulations. Int J Climatol 42(14): 7228-7251.
- Mbanyele W, Muchenje LT (2022) Climate change exposure, risk management and corporate social responsibility: Cross-country evidence. J Multinatl Financ Manag 66: 100771.
- Yakubu SO, Falconer L, Telfer TC (2022) Scenario analysis and land use change modelling reveal opportunities and challenges for sustainable expansion of aquaculture in Nigeria. Aquac Rep 23: 101071.
- Frimpong BF, Koranteng A, Molkenthin F (2022) Analysis of temperature variability utilizing Mann-Kendall and Sen's slope estimator tests in the Accra and Kumasi Metropolises in Ghana. Environ Syst Res 11(1): 1-13.
-
 Table 1
 -
Table 2


QUICK LINKS
- SUBMIT MANUSCRIPT
- RECOMMEND THE JOURNAL
-
SUBSCRIBE FOR ALERTS
RELATED JOURNALS
- Advances in Nanomedicine and Nanotechnology Research (ISSN: 2688-5476)
- Journal of Veterinary and Marine Sciences (ISSN: 2689-7830)
- Proteomics and Bioinformatics (ISSN:2641-7561)
- Journal of Microbiology and Microbial Infections (ISSN: 2689-7660)
- Journal of Genomic Medicine and Pharmacogenomics (ISSN:2474-4670)
- Food and Nutrition-Current Research (ISSN:2638-1095)
- Journal of Genetics and Cell Biology (ISSN:2639-3360)